Content

We have secured the raw data in the bronze layer. We have cleaned and verified it in the silver layer. But if you give a CEO direct access to the silver layer, they will likely be frustrated. The data is there, but it is technical, complex, and hard to query.
This is why we need the gold layer.
In the medallion architecture, it is the “Showroom.” It is the final destination where data is polished, packaged, and presented as a finished product.
This is the layer that powers your Business Intelligence (BI). When a sales director opens a dashboard to check quarterly performance, they are looking at gold data. The goal here is no longer “purity” or “auditability”—it is speed and simplicity. It transforms abstract data tables into answers for specific business problems.
What Is the Gold Layer? Organizing Data for Specific Business Needs
While the silver layer is an “Enterprise View” (a massive list of everything), the gold data layer is organized into project-specific databases.
Think of it as creating tailored magazines for different departments. The Marketing team gets a “Customer Analytics” data mart. The Logistics team gets an “Inventory Health” data mart. The Finance team gets a “Revenue” data mart.
This organization makes the data consumption-ready. A marketing analyst does not need to wade through manufacturing logs to find a customer email. In the gold layer, we strip away the noise and present only the fields relevant to that specific team. This structure allows users to build their own reports without calling IT for help every time.
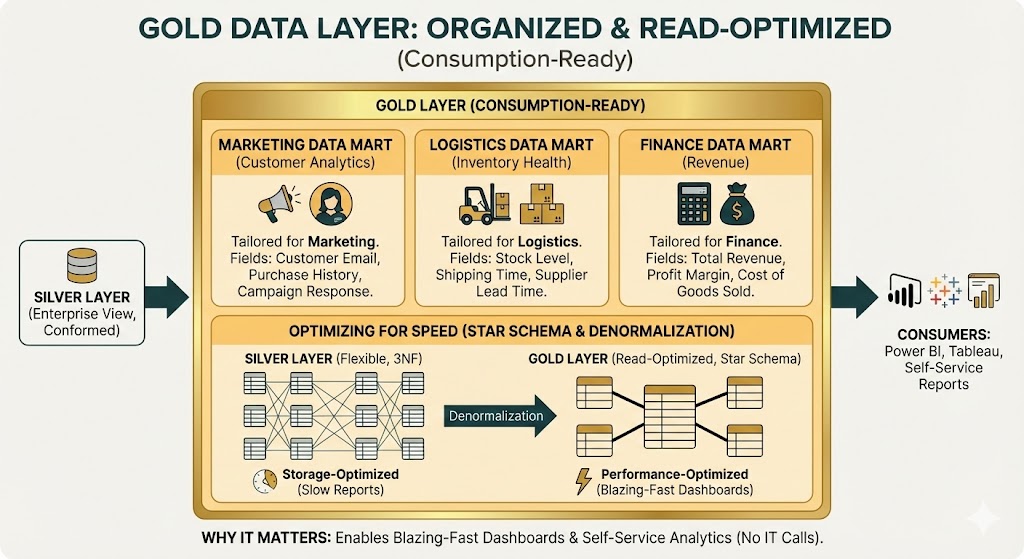
Optimizing Data for Speed – Why We Use the Star Schema
Have you ever opened a Power BI report and watched the little wheel spin for 30 seconds? That usually happens because the data model was designed for storage, not for reading.
The gold layer fixes this by being read-optimized.
In the previous Silver layer, we prioritized flexibility (using 3rd Normal Form). In the golden layer, we prioritize performance. We often use a design pattern called the Star Schema (or Kimball style).
This involves “denormalization.” Instead of forcing the computer to jump between ten different tables to find a “Product Name” and a “Sales Region,” we combine those details into fewer, wider tables. This reduces the work the database has to do. The result is blazing-fast dashboards that respond instantly when a user clicks a filter.
Are your Power BI reports slow and inconsistent?
Stop doing heavy math in the dashboard. Our experts build high-performance data marts that centralize your KPIs and make analytics instant, accurate, and ready for the C-Suite.
Make your data decisions faster.

Make your data decisions faster.
Centralizing Business Logic for Consistent Data Reporting
The golden layer is the home of your business logic.
Too often, companies let individual analysts calculate Key Performance Indicators (KPIs) in their own Excel files or BI tools. This leads to chaos: the Finance report says margin is 15%, but the Sales report says 18% because they used different formulas.
We “bake in” these rules. We calculate complex metrics—like Net Promoter Score, Monthly Recurring Revenue, or Customer Lifetime Value—once, inside the database.
By pre-calculating these numbers, you guarantee consistency. Whether someone looks at the data in Tableau, Power BI, or a simple spreadsheet, the “Net Profit” number is always identical.
Cross-Domain Analytics & Data – Connecting Disparate Departments
The most powerful advantage of the modern Lakehouse architecture is the ability to do cross-domain analytics.
In traditional systems, manufacturing data lived in one server and sales data in another. They never met.
With the golden layer, we can easily combine these worlds. You can build a dataset that correlates “Manufacturing Machine Defects” (from IoT sensors) directly with “Customer Returns” (from the CRM). This allows you to answer complex questions, like: “Did the temperature spike in Factory B cause a 10% increase in returns for Product X last month?”
This type of analysis was once too expensive or technically difficult for most companies. Now, it is a standard capability of the gold layer.
Our Data Consulting Services You Might Find Interesting


The Consultant’s Angle – Why Logic Belongs in the Database, Not Power BI
A mistake we see frequently is companies trying to skip the golden layer. They connect Power BI directly to the raw or silver data and try to write complex formulas (DAX) to fix the mess.
This is a trap.
Visualization tools like Power BI are designed to display data, not to engineer it. If you force the tool to do heavy calculations for every user, the reports will be slow and hard to maintain.
The rule of thumb is simple: Logic belongs in the database (gold layer). Visualization belongs in the tool. If you move the heavy lifting back to the golden architecture schemas, your dashboards will remain fast and agile, no matter how much data you add.
How Multishoring Turns Gold Data into Strategic Decisions
The gold layer is where your investment in data finally pays off. It is the bridge between technical code and business revenue.
At Multishoring, we specialize in building that bridge. Our Data Analytics & Strategy Consulting teams work with your business leaders to define the KPIs that matter. Then, our engineers build the high-performance gold models to support them. Finally, our Microsoft Power BI Consulting experts create the visual dashboards that put those answers at your fingertips.
Do not let your data sit unused in a warehouse. Contact Multishoring today to turn your hidden data into a high-performance decision engine.