
Content

Manufacturing plants generate high volumes of data daily through production schedules, supply chain logs, and enterprise systems. Yet, many teams struggle to use this data to improve margins, increase throughput, or reduce unplanned downtime.
We outline how to build a 12-to-36-month transformation plan that standardizes your data foundation and deploys practical use cases like OEE optimization and predictive maintenance.
Why Do Manufacturing Data Initiatives Fail?
Installing IoT sensors or buying a new cloud data lake without defining which operational decisions those tools will support leads to zero return on investment.
If the IT team connects the ERP to a reporting tool, but the resulting data does not help a plant manager reduce scrap rates or speed up changeovers, the project yields no financial return. A successful data strategy maps strategic objectives (like margin expansion) to operational levers (like labor productivity or material cost), and builds data products around the people pulling those levers.
What Is a Decision-Centric Data Strategy?
A decision-centric strategy identifies the specific human decisions that impact your Key Performance Indicators (KPIs) and builds the exact data sets required to support them. You establish this alignment using a four-step framework:
- Identify Strategic Priorities: Select 3 to 5 core business goals, such as capacity growth, quality improvement, or supply chain resilience.
- Map to Operational Levers: Link those priorities to measurable levers. Margin expansion, for example, ties directly to pricing, material cost, scrap rates, and unplanned downtime.
- Define Recurring Decisions: Identify the roles (maintenance supervisors, line leads, supply chain managers) and their daily choices that affect those levers.
- Specify the Data Product: Design the dataset or dashboard required to support that decision at the right latency (e.g., real-time shift data vs. monthly financial roll-ups).
Shifting from Dashboards to Data Products
Instead of answering ad-hoc IT requests for new tables, a decision-centric team builds data products. A data product is a curated, documented asset designed for a specific user. Examples include a defect traceability dataset for quality engineers, or a demand-supply risk view for S&OP (Sales & Operations Planning) teams. You evaluate each product by its business outcome: did it reduce quality escapes or improve schedule adherence?
Is your factory data driving actual business value?
Our experts design comprehensive, 12-to-36 month data strategy roadmaps that connect your MES and ERP systems directly to KPIs like OEE, OTIF, and margin growth.
Align your data with your goals.

Align your data with your goals.
What Are the Phases of a 36-Month Manufacturing Data Roadmap?
A standard roadmap for a mid-market or enterprise manufacturer spans 12 to 36 months, moving from diagnostic assessments to advanced AI implementations across four phases.
Phase 0 & 1: Diagnostics and Data Foundations (Months 0–9)
The first 3 months (Phase 0) involve assessing current systems (MES, SCADA, PLCs, ERP, QMS) and mapping data flows to find manual Excel integrations and mismatched product codes.
Months 3 through 9 (Phase 1) focus on standardizing this data. This includes harmonizing master data (BOMs, routings, asset IDs) and setting up a central integration layer where IT and OT data can combine.
Phase 2: Priority Analytics Use Cases (Months 6–18)
With a clean foundation, you deploy the first wave of data products. Typical deliverables in this phase include real-time Overall Equipment Effectiveness (OEE) monitoring, baseline maintenance analytics, and automated quality dashboards.
Phase 3 & 4: Advanced Analytics, AI, and Scaling (Months 12–36+)
Once users trust the foundational reporting, the organization introduces advanced capabilities. This includes deploying machine learning for predictive maintenance, anomaly detection, and dynamic inventory optimization.
Phase 4 scales these models across different plants and business units while embedding analytics into continuous improvement (Lean/Six Sigma) routines.
Which Analytics Use Cases Deliver ROI in Manufacturing?
When selecting analytics use cases, prioritize those with a measurable impact on On-Time In-Full (OTIF) delivery or First-Pass Yield (FPY). Score these potential use cases based on business value, data readiness, and feasibility. Common high-impact use cases include:
OEE and Throughput Optimization
Combining machine sensor data with production schedules allows you to monitor availability, performance, and quality in real time. Plant managers use this to drill down into specific loss categories—like micro-stops, changeovers, or scrap—and address the exact bottlenecks slowing down throughput.
Predictive Maintenance and Quality Analytics (SPC)
Applying machine learning to historical maintenance logs and live sensor data helps predict equipment failures, reducing unplanned downtime. Monitoring Statistical Process Control (SPC) parameters in real time identifies patterns leading to defects, which supports root-cause analysis and Corrective and Preventive Action (CAPA) processes.
S&OP and Supply Chain Visibility
Connecting historical order data, market signals, and supplier lead times improves demand forecasting. Better forecasts align production schedules and optimize inventory, lowering the working capital tied up in excess stock while preventing stockouts that impact OTIF performance.
How Do You Connect Operational and Financial Systems?
Connecting Operational Technology (OT) and Information Technology (IT) requires a modern architecture pattern, typically a data lakehouse, governed by strict metric hierarchies. Legacy architectures force companies to build separate data silos for streaming machine data and financial records. Modern roadmaps account for industrial protocols and legacy systems coexisting with cloud platforms.
The Lakehouse Architecture Pattern
Many manufacturers adopt hybrid or lakehouse patterns using technologies like Databricks and Power BI. This architecture stores high-velocity time-series sensor data (OT) alongside transactional ERP data (IT) in a single, governed platform. It uses event-driven ingestion to buffer data at the edge, so a sudden spike in machine logs does not interrupt production systems.
Metric Hierarchies and Data Governance
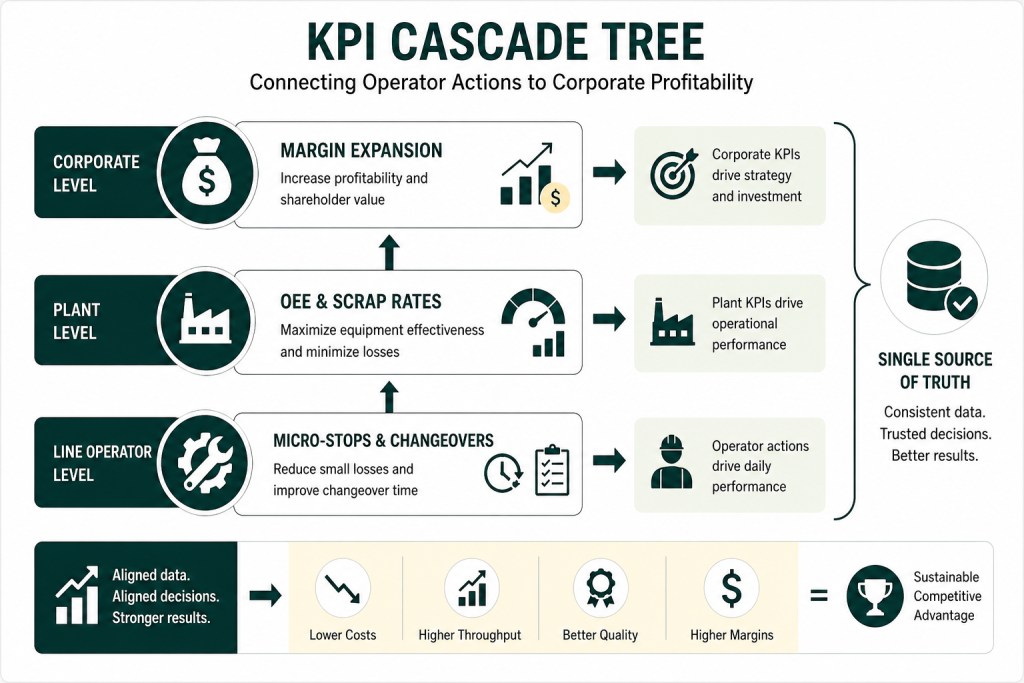
Metric consistency is a common challenge in manufacturing. Different plants often calculate OEE or scrap rates differently. A roadmap must include data governance to establish central metric definitions. You build metric hierarchies that connect top-level corporate KPIs down to the operator level.
For instance, a corporate margin KPI decomposes into plant-level OEE, which decomposes into line-level availability, which drills down to specific machine changeover times. This structure ensures that a line operator fixing a micro-stop impacts the executive dashboard accurately.
Our Data Consulting Services You Might Find Interesting

Data Warehouse Consulting Services
We design, build, and modernize data warehouses that bring order to your fragmented data.

Modern Data Architecture Services
We design and implement data architectures that replace aging legacy systems with a scalable cloud foundation.

Data Governance Consulting & Integration
We help you build a practical system of trust around your information. We work with you to make sure your data is accurate.
How Multishoring Delivers Your Manufacturing Data Roadmap?
At Multishoring, we guide manufacturers through this multi-year process. We start with a Data & Analytics Maturity Assessment to map your strategic goals to candidate use cases. From there, we design the target architecture, clean the master data, and build the automated pipelines connecting PLCs and MES systems to the ERP. By delivering prioritized data products in Power BI and Databricks, we help you transition from manual spreadsheet reporting or legacy systems to automated data pipelines and real-time manufacturing dashboards.


