
Content

Your Snowflake, BigQuery, or Redshift adoption is a success. Your data team is growing, dashboards are multiplying – and so is the bill. Finance is asking questions you can’t answer cleanly.
Here’s the uncomfortable truth: industry estimates suggest 30-50% of cloud data warehouse spend is wasted on idle compute, oversized clusters, and poorly governed queries. Most of it is fixable without slowing the business down.
This article focuses specifically on compute spend – warehouses, slots, clusters, query execution – which is where the real money goes once adoption scales. We’ll cover four things: how pricing models create the problem, how to make costs visible, the concrete levers to pull, and how to build a governance habit that keeps costs from creeping back up.
Why Cloud Data Warehouse Bills Keep Growing
Cloud data warehouse pricing looks simple on paper. In practice, it creates spend patterns that are easy to miss until the month-end invoice lands.
The three dominant models work very differently:
| Pricing Model | How You Pay | Key Risk |
|---|---|---|
| Consumption / serverless (Snowflake credits, BigQuery on-demand) | Per query execution time or TB scanned | Bad SQL and unfiltered dashboards drive unbounded spend |
| Slot-based / reserved (BigQuery slots, Redshift reserved instances) | Fixed capacity commitment | You pay for idle capacity whether it’s used or not |
| Node-based / provisioned (Redshift classic) | Per provisioned node, always on | Cluster sized for peak load sits underused 80% of the time |
The counterintuitive part: data volume matters less than behavior. A single dashboard refreshing every 15 minutes without filters can cost more than a well-tuned nightly batch job processing billions of rows. A Snowflake “Large” warehouse left running over a weekend. A BigQuery report scanning 400 GB on a schedule because nobody added a date filter. These are billing problems disguised as engineering habits.
Understanding which model you’re on – and how your team’s behavior interacts with it – is the first step to getting control.
Still guessing why your cloud data warehouse bill keeps growing?
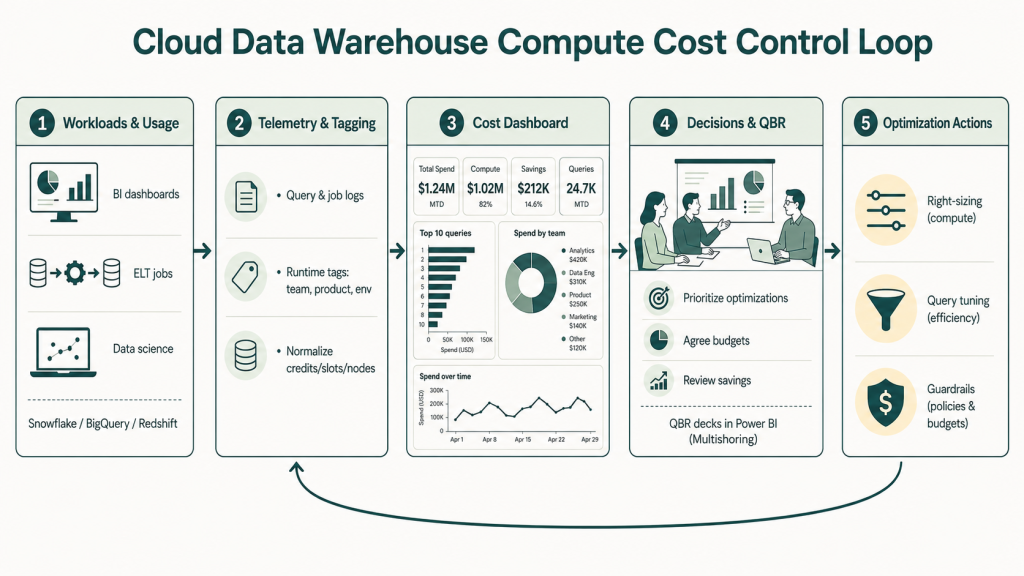
We help data and IT teams baseline their compute spend, build cost dashboards in Power BI, and run QBRs that finance and leadership can act on – across Snowflake, Databricks, and Azure Data Factory environments.
No commitment. Just a conversation about your data warehouse costs.

No commitment. Just a conversation about your data warehouse costs.
You Can’t Optimize What You Can’t See
Your cloud invoice tells you spend went up. It won’t tell you which team’s dashboard caused it, which query scanned 600 GB unnecessarily, or which dev environment ran all weekend. That gap is where most optimization efforts stall.
Step 1 – Get execution-level telemetry
Move beyond invoice-level views. Each platform exposes query and job logs you can pull into your own monitoring layer:
- Snowflake – query history, warehouse metering, resource monitor alerts
- BigQuery –
INFORMATION_SCHEMA.JOBS, billing export tables, job labels - Redshift – system tables (
STL_QUERY,SVL_QUERY_METRICS), CloudWatch cluster metrics
The goal is normalizing vendor-specific units – credits, slots, DBUs – into a single internal cost model so teams can compare workloads on equal terms.
Step 2 – Tag everything at runtime
Infrastructure-level tags aren’t enough. You need metadata that captures team, product, environment, and purpose at query execution time – not just on the cluster or dataset. Without this, cost dashboards show you totals, not owners.
Step 3 – Build a cost dashboard that drives decisions
A useful data warehouse cost dashboard surfaces:
- Top 10 most expensive queries or jobs over a rolling period
- Warehouses or clusters with lowest utilization rates
- Off-hours and weekend compute for non-critical workloads
- Cost trends by team, domain, or environment (dev/test/prod)
Many teams pull this directly into Power BI rather than paying for a separate observability tool. This is also where the data feeds your QBR – a quarterly business review where platform, finance, and product owners align on spend, value, and the next round of optimizations. Multishoring helps clients build exactly this: executive-ready Power BI QBR decks that translate raw warehouse telemetry into a narrative finance and business stakeholders can act on.
Four Levers to Cut Compute Spend
Once you can see where the money is going, these are the levers that actually move the number.
1. Right-size and autosuspend warehouses
Most warehouses are sized for peak load and left running the rest of the time. Start by pulling 3+ months of utilization data. If a warehouse regularly sits below 30-40% utilization, it’s oversized – drop it a tier and watch performance.
More impactful: configure autosuspend aggressively. Dev and test environments should stop after 5-10 idle minutes. Production after slightly longer, but still tight. Teams that do this consistently report 30-50% reductions in idle compute costs – without any change to query logic.
2. Separate workloads into dedicated pools
Mixing dashboards, ELT jobs, and data science experiments on a single shared compute pool is one of the most common and costly mistakes. A long-running model training job will starve an executive dashboard of resources – and both workloads end up slower and more expensive.
Separate them. Dedicated Snowflake warehouses per domain. Slot reservations split by workload type in BigQuery. WLM queues in Redshift. This also lets you tune scaling rules per pattern rather than compromising for everything at once.
3. Fix the query patterns that cost the most
Three habits drain compute silently:
- SELECT * on large tables – scanning columns you never use
- Missing date filters on dashboard queries refreshing against months of data
- Joins applied before the most selective filters reduce the dataset
Effective partitioning and clustering (date-based for time-series, domain keys for filters you use often) directly reduces data scanned – which in consumption-based models maps 1:1 to cost. Multishoring’s teams work across Snowflake, Databricks, and Azure Data Factory environments and see these patterns repeatedly in data model audits.
4. Set guardrails before problems escalate
Resource monitors, query scan limits, and cost thresholds should be standard configuration – not an afterthought. A policy like “cancel any query scanning more than 500 GB on shared warehouses” or “alert when a warehouse exceeds 20 credits in an hour” catches runaway jobs before they become line items in the monthly invoice.
Our Data Consulting Services You Might Find Interesting

Data Warehouse Consulting Services
We design, build, and modernize data warehouses that bring order to your fragmented data.

Modern Data Architecture Services
We design and implement data architectures that replace aging legacy systems with a scalable cloud foundation.

Data Governance Consulting & Integration
We help you build a practical system of trust around your information. We work with you to make sure your data is accurate.
Make Cost Control a FinOps Habit
The optimizations in the previous section will move your bill. What keeps it down is building a governance rhythm around them – so costs don’t quietly creep back up as the platform grows.
Map FinOps phases to what you already have
FinOps is a discipline that combines financial accountability with engineering practice. It works in three phases – and if you’ve followed this article, you’re already most of the way there:
| FinOps Phase | What it means | What you’ve built |
|---|---|---|
| Inform | Make costs visible and attributable | Cost dashboard, telemetry, tagging |
| Optimize | Act on what you see | Right-sizing, autosuspend, query fixes, guardrails |
| Operate | Sustain and govern | Budgets, alerts, QBR cadence |
The “Operate” phase is where most teams stall. Visibility and one-off tuning are relatively easy. Keeping the discipline alive quarter after quarter is harder.
Give every team ownership of their spend
Showback and chargeback – attributing compute costs to specific teams, domains, or data products – changes behavior faster than any technical fix. When a team can see that their poorly optimized dashboard costs $4,000 a month to run, optimization becomes a business conversation, not just an engineering task.
Build monthly cost-per-domain reports from the same dashboard you’ve already built. Use them to run “unit economics” discussions: cost per report, cost per pipeline, cost vs business value delivered.
Set budgets and anomaly alerts at the workload level
Global account-level alerts are too blunt. By the time a global threshold fires, the damage is done. Set budget alerts per team or per warehouse so the right people are notified early – before a spike becomes a month-end surprise.
Most platforms offer native anomaly detection. Use it. A sudden 3x spike in credits on a specific warehouse almost always has a traceable cause – a new dashboard with no filters, a scheduled job that lost its partition pruning, a development query that hit production compute.
Run a quarterly business review on platform costs
A QBR focused on data platform economics – where platform, finance, and product owners sit together – is the operating mechanism that makes everything else stick. A well-structured QBR covers three things: progress vs budget from last quarter, top optimizations delivered and savings realized, and new initiatives with projected cost impact.
The deck should mix technical metrics with business language. Utilization rates and top queries for the engineering team. Cost per business unit and cost vs value delivered for finance and leadership. That translation layer is exactly where Multishoring helps clients – building Power BI QBR decks that turn raw warehouse telemetry into a narrative executives can act on.
Where to Start: A 5-Step Checklist
Compute costs in cloud data warehouses are manageable – but only when visibility, platform tuning, and governance work together. Most organizations already have the raw data they need to get control; what’s missing is the structure to act on it consistently. Here’s what to do in the next two weeks:
- Baseline your spend – pull 3+ months of compute vs storage vs transfer costs, segmented by warehouse or cluster
- Build a first cost dashboard – surface top 10 expensive queries, utilization by warehouse, and off-hours compute
- Implement autosuspend – configure aggressive idle thresholds on all non-production environments immediately
- Fix your top 10 worst queries – identify the highest-cost jobs, check for missing filters, SELECT *, and partition misuse
- Schedule your first QBR – get platform, finance, and one business stakeholder in the same room to review spend and agree priorities
If you need help turning warehouse telemetry into executive-ready Power BI dashboards and QBR decks – that’s work Multishoring does regularly across Snowflake, Databricks, and Azure Data Factory environments.


