
Content

AI is changing business intelligence from something you read to something you ask – but only if the data underneath is ready for it. For years, BI meant dashboards: someone built the report, you interpreted it, and if you had a new question you waited for the next one. AI-augmented BI, often called augmented analytics, flips that. You ask the question in plain language and get an answer, an explanation, and the next question to consider.
That is a real shift, not a cosmetic one. The bottleneck in most BI programs was never the data – it was the distance between a business question and an answer, measured in dashboards, tickets, and days. AI compresses that distance. Done well, more people make more decisions from data, faster, without routing every question through an analyst.
But there is an honest caveat, and it runs through this entire guide: AI-augmented BI is only as good as the data and governance beneath it. Point AI at messy, ungoverned data and you get fast, confident, wrong answers – which is worse than a slow dashboard. The value is real, and so is the prerequisite.
This guide is for the people who own that decision – heads of BI, CDOs, and the finance and operations leaders who live in the numbers. It covers what AI-augmented BI actually changes, how conversational and generative analytics work, what it takes to do this safely, the use cases worth starting with, and how to adopt AI in BI without losing trust in your numbers. The goal is a clear-eyed view: real value, real requirements, no hype.
What AI-augmented BI actually changes
The real change is not prettier dashboards – it is who gets to ask questions and how fast they get answers. Traditional BI put a specialist between the business and the data. AI-augmented BI removes that bottleneck, which changes who can use data and what they can do with it.
To see the shift clearly, it helps to line up the old model against the new one.
| Traditional BI | AI-augmented BI | |
|---|---|---|
| How you get an answer | Read a pre-built dashboard or request a report | Ask a question in plain language |
| Who can do it | Analysts and BI specialists | Anyone in the business |
| New questions | Wait for the next report cycle | Ask follow-ups immediately |
| What it surfaces | What you thought to chart | Patterns and drivers you did not think to ask about |
| The work | Building and interpreting reports | Deciding and acting on answers |
From describing the past to guiding the decision
Traditional BI is mostly descriptive – it tells you what happened. AI adds three things on top:
- Explanation. Not just that margin fell, but the likely drivers behind it – so you spend less time hunting for the “why.”
- Prediction. Where things are heading, drawing on patterns in the data, rather than only where they have been.
- Recommendation. A suggested next step, which a human still judges and decides. The point is to inform the decision, not to remove the human from it.
This is the “from dashboards to decisions” shift. The value moves from producing information to acting on it – which is where business value was always meant to be.
What this means for your BI team
A reasonable fear is that this makes the BI team redundant. It does the opposite. It changes the job. Less time spent building routine reports and fielding one-off data requests; more time on the harder, higher-value work – modeling the data properly, governing it, defining metrics everyone can trust, and handling the questions AI cannot. AI-augmented BI does not replace your data team; it moves them up the value chain, from report factory to the people who make self-service trustworthy.
There is a catch worth naming now, because it shapes everything that follows. This only works when everyone asking questions is working from the same governed, well-defined data. Give a hundred people natural-language access to inconsistent data and you do not democratize insight – you democratize confusion. That prerequisite is the subject of Section 3. First, how the “asking” actually works.
Ready to move from dashboards to decisions?
AI-augmented BI only works on a governed, AI-ready foundation. We help enterprises modernize their BI and data so self-service answers can actually be trusted.
Trusted answers start with the data underneath.

Trusted answers start with the data underneath.
Conversational and generative analytics
The mechanism behind AI-augmented BI is simple to describe: you ask in plain language, and the system does the querying for you. No SQL, no waiting on a report. This is where “from dashboards to decisions” becomes tangible, and it is worth understanding how it works – and where it breaks.
Two related capabilities are doing the work here.
Conversational analytics: asking questions in plain language
Conversational analytics lets a business user ask a question the way they would ask a colleague – “why did sales dip in the northeast last month?” – and get an answer back. Under the hood, the system translates the question into a query, runs it against your data, and returns the result with an explanation. You can then follow up, drill in, and keep going, in a conversation rather than a report request.
The payoff is speed and reach. A regional manager gets an answer in the flow of a meeting, not three days later. The barrier of “you need to know how to query the data” comes down, which is what actually widens who can use BI.
Generative analytics: from answer to narrative
Generative AI adds a layer on top: it does not just return a number, it explains it in words. Instead of a chart you have to interpret, you get a short narrative – what happened, the likely drivers, and what to look at next. For a busy executive, a clear paragraph often beats a dashboard they have to decode.
This is also where agentic analytics is heading – AI agents that do not just answer one question but carry out a small analytical task: monitor a metric, investigate an anomaly, and surface the finding without being asked. That is the same pilot-to-production challenge agents face everywhere, applied to BI. (We cover it in our guide to enterprise AI agents.)
Where it breaks – and why trust is the whole game
Here is the part the demos gloss over. A conversational BI system will almost always give you an answer – the question is whether it is the right one. Two failure modes matter:
- It misreads the question. Natural language is ambiguous. “Best region” – by revenue, margin, or growth? If the system guesses wrong, the answer is confidently off.
- It runs on bad or inconsistent data. If “revenue” is defined three different ways across your systems, the AI will happily pick one and never tell you which.
The consequence is specific and serious: a wrong answer in conversational BI is more dangerous than a wrong dashboard, because it arrives with fluent, confident language and no chart to sanity-check. People believe it. That is exactly why the data foundation and clear metric definitions – the next section – are not optional groundwork but the thing that makes any of this safe to use.
What it takes: data readiness and governance
AI-augmented BI does not lower the bar on your data – it raises it. The moment anyone can ask anything in plain language, every weakness in your data becomes a wrong answer someone acts on. The dashboards used to hide those weaknesses behind a curated view. Self-service AI removes the curtain.
So the prerequisite is not a nice-to-have. Two foundations have to be in place before you turn this loose on the business: AI-ready data, and governance – especially a shared definition of what your metrics mean.
AI-ready data
The data feeding an AI-augmented BI system has to be genuinely ready for it: governed, high-quality, well-structured, and accessible. If it is scattered across silos, inconsistent, or full of gaps, conversational BI will surface those problems at speed and with confidence. This is the same readiness bar that decides whether any AI reaches production, applied to analytics. We cover it in depth in our guide to preparing enterprise data for AI – it is the foundation this whole capability stands on.
A shared semantic layer: one definition of the truth
The single most important governance piece for AI-augmented BI is agreeing what your metrics mean. If “active customer,” “revenue,” or “churn” is defined differently across teams and systems, then a hundred people asking questions get a hundred subtly different answers – all delivered with equal confidence.
A semantic layer solves this: a governed, central definition of your key metrics and business terms that the AI queries against. It is what lets self-service scale without fragmenting into chaos. Without it, democratized BI becomes democratized disagreement.
Governance and access control
The rest of the governance picture matters too:
- Access control. When anyone can query in natural language, permissions have to hold – a user should only get answers from data they are allowed to see. Conversational access makes row- and column-level security more important, not less.
- Trust and transparency. Users need to know where an answer came from. An AI-augmented BI system should be able to show its work – the data and logic behind a number – so people can trust it and catch errors.
- Consistent, governed data. The same discipline that makes AI safe to run generally – lineage, quality, ownership – is what keeps BI answers reliable. This is where AI-augmented BI meets your broader AI governance and data-governance work.
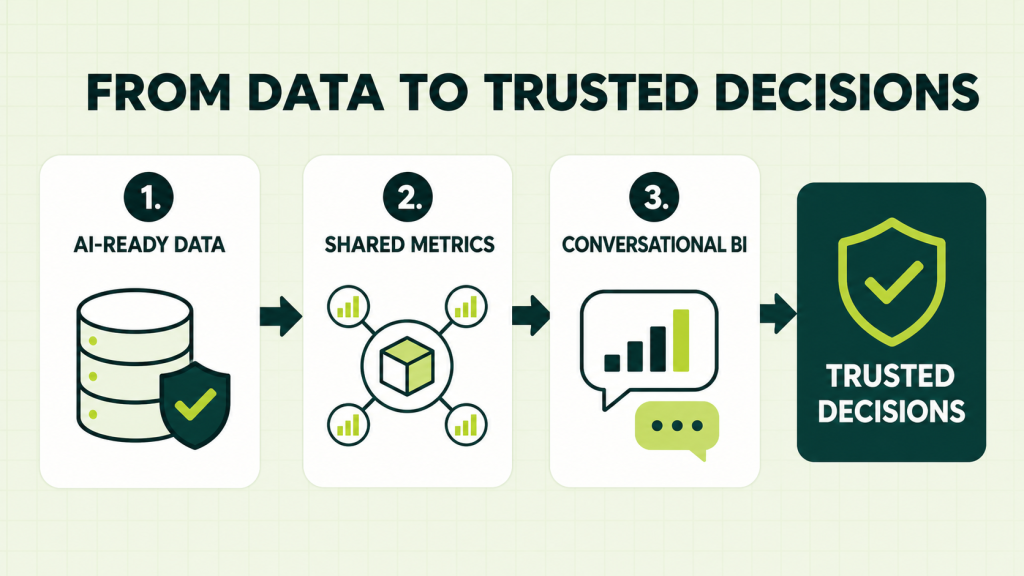
The honest sequence
There is an order to this, and skipping it is the classic mistake:
- Get the data AI-ready – governed, quality, accessible.
- Define the metrics – a semantic layer everyone shares.
- Then open up conversational, self-service access.
Do it in that order and AI-augmented BI is a force multiplier. Do it in reverse – switch on natural-language access over messy, undefined data – and you scale confusion faster than you ever could before. The good news for most enterprises: if you have invested in data warehousing, BI, and governance, you have a real head start. The task is to extend that foundation, not build it from nothing.
Realistic use cases
Start where the questions are frequent, the data is solid, and a wrong answer is not catastrophic. AI-augmented BI pays off fastest on everyday decisions that today wait on an analyst – not on your most sensitive, high-stakes reporting. Below are the common patterns, kept general – your best first use case is the one that fits your data and your teams.
- Self-service answers for business teams. Let non-technical staff ask routine questions – sales, operations, marketing performance – in plain language, instead of queuing report requests. This is the highest-volume, lowest-risk starting point, and it frees the BI team from repetitive asks.
- Faster financial and operational reporting. Generative summaries turn a monthly pack into a plain-language narrative – what moved, and the likely drivers. Useful for finance and operations reviews, on well-governed data everyone already trusts.
- Anomaly spotting and monitoring. AI watches key metrics and flags unusual movements, so issues surface early rather than at the next review. A natural fit for agentic analytics, and best kept to metrics with clean, reliable data.
- Exploratory analysis and follow-ups. Let analysts and managers drill into a result conversationally – asking “why,” then “why there,” then “what changed” – without building a new report for each question. This is where the “dashboards to decisions” shift is felt most directly.
A simple rule for sequencing: pick the use case with high question-frequency, good underlying data, and a contained downside. Prove the value there, build trust in the answers, then extend to higher-stakes reporting once the data foundation and the users’ confidence are solid. Chasing the most impressive use case first – on your most sensitive numbers – is how a promising rollout loses the room’s trust early.
How to adopt without losing trust in the numbers
The fastest way to kill an AI-augmented BI rollout is one confident, wrong answer in front of the wrong executive. Trust is the whole asset. Lose it early and people quietly go back to their old dashboards, no matter how good the technology is. So adopt in a way that builds trust deliberately.
| Principle | What it means | The mistake it avoids |
|---|---|---|
| Foundation before features | Do not switch on natural-language access until the data is AI-ready and the metrics are defined | Scaling confusion faster over messy, undefined data |
| Start narrow, on trusted data | Begin with one team and a domain where data is clean and metrics are agreed | A broad launch that fails publicly and loses the room |
| Make the AI show its work | Every answer traceable to its source and logic | Users trusting – or being burned by – a black box |
| Human in the loop for big calls | AI informs decisions; it does not silently make them | Acting on a confident answer no one verified |
| Teach people to question answers | Enough literacy to ask “does this look right, and where’s it from?” | Fluent prose being mistaken for correct prose |
The throughline is honesty about what the technology is: a powerful way to get more people to more answers faster, resting on a foundation of governed, well-defined data. Build the foundation, roll out narrowly, keep answers transparent and humans accountable, and AI-augmented BI becomes what it promises – a shift from dashboards to decisions your organization can actually trust.
Summary: dashboards to decisions, done right
AI-augmented BI is a genuine shift – from reading dashboards to asking questions and acting on the answers – and it is only as good as the data and governance beneath it. The upside is real: more people making more decisions from data, faster, with the BI team freed to move up the value chain. The prerequisite is equally real, and skipping it turns the upside into confident, fast, wrong answers.
The path in short: understand that the change is about who can ask and how fast they get answers, not prettier charts; use conversational and generative analytics to close the gap between question and decision; and put the foundation first – AI-ready data plus a shared definition of your metrics – before opening self-service access. Start narrow on trusted data, keep every answer transparent and traceable, and keep a human accountable for consequential calls.
The organizations that win with AI-augmented BI are not the ones that bought the flashiest tool. They are the ones that did the unglamorous work – governed data, defined metrics, a careful rollout – so that when someone asks a question in plain language, the answer can be trusted. Get that right and BI finally delivers what it always promised: not more reports, but better decisions.
Frequently asked questions about AI-Augmented BI
What is AI-augmented BI?
AI-augmented BI, often called augmented analytics, uses AI to let people get insights from data by asking questions in plain language rather than only reading pre-built dashboards. It adds explanation, prediction, and recommendation on top of traditional reporting, shifting the work from producing information to acting on it. The answers are only as reliable as the governed data underneath.
How is augmented analytics different from traditional business intelligence?
Traditional BI delivers pre-built dashboards and reports that a specialist creates and you interpret. Augmented analytics lets any business user ask questions directly, get answers and explanations, and follow up immediately – without waiting on a report cycle. It widens who can use data and moves the focus from building reports to making decisions.
Does AI-augmented BI replace analysts and BI teams?
No – it changes the role. AI handles routine reporting and one-off data requests, which frees the BI team for higher-value work: modeling data, defining trusted metrics, governing the data, and answering the harder questions AI cannot. In practice it moves the team from a report factory to the people who make self-service trustworthy.
What do we need before adopting AI-augmented BI?
Two foundations: AI-ready data (governed, high-quality, well-structured, accessible) and a shared semantic layer that defines what your key metrics mean. Without consistent definitions, natural-language access gives different people different answers to the same question. Get the data and metric definitions right first, then open up self-service access.
Can we trust the answers from conversational BI?
Only as far as the data and governance allow. A conversational system will almost always return an answer, but it can misread an ambiguous question or run on inconsistent data – and it delivers the result in confident language with no chart to sanity-check. Trustworthy adoption means defined metrics, transparent answers that show their source, and a human verifying consequential decisions.
Where should we start with AI-augmented BI?
Start with a high-frequency, lower-risk use case on data you already trust – self-service answers for a business team, or plain-language summaries of routine reporting. Prove the value and build confidence there before extending to more sensitive, high-stakes numbers. Sequencing this way protects trust, which is the hardest thing to rebuild once lost.
AI-augmented BI turns dashboards into plain-language questions, explanations, and faster decisions. The upside depends on AI-ready data, shared metric definitions, transparent answers, and a narrow rollout that protects trust.