
Content

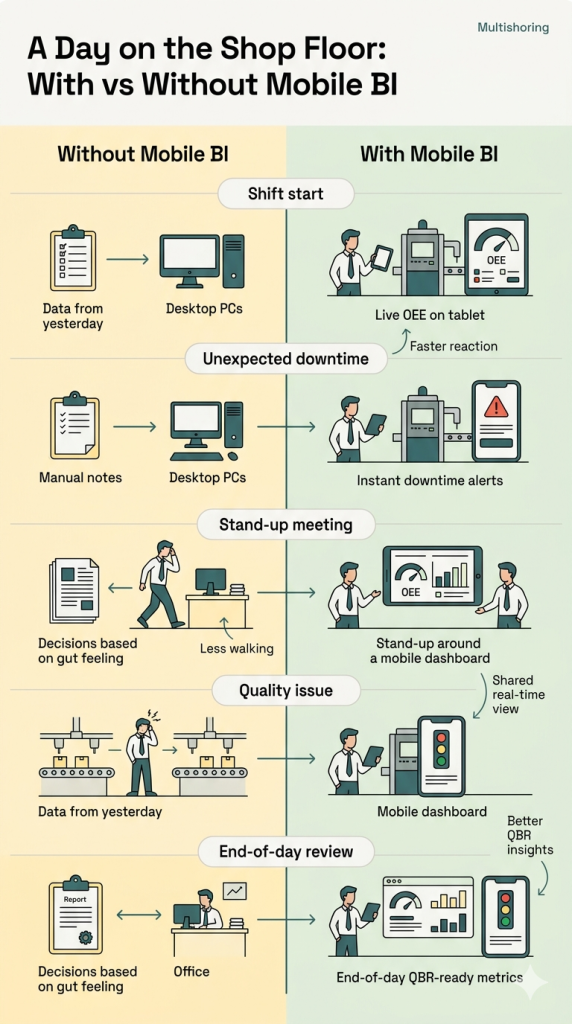
Mobile business intelligence cuts reaction times to shop floor bottlenecks by putting live KPIs directly into the hands of your production team. Picture a shift manager walking between production lines, trying to reconcile yesterday’s printed OEE report with a machine that just went offline. The critical data they need is stuck on an office PC. Switching from clipboards and paper reports to BI reports on tablet devices eliminates this delay, allowing your team to diagnose and solve problems right where they happen.
For manufacturing executives, deploying mobile BI is the fastest way to close the gap between data generation and operational action. By making your existing analytics accessible as mobile BI reports on the shop floor, you eliminate lagging indicators and empower plant managers to make immediate, margin-saving decisions on downtime, quality control, and resource allocation without ever leaving the production line.
Modern mobile business intelligence allows decision-makers to access real-time dashboards, trigger alerts, and perform quick drill-downs during daily stand-up meetings or while inspecting a faulty machine. Viewing BI reports on phone screens means supervisors get instant notifications the moment schedules deviate. At Multishoring, we regularly help manufacturing companies build complex Power BI models and executive QBR decks. We know from experience that extending those exact data models into mobile Power BI experiences is the most effective way to drive user adoption and accelerate daily operations.
Empower Your Shop Floor with Mobile-Ready Power BI
Don’t let critical production insights stay trapped on office desktops. We bridge the gap between complex data and practical, touch-ready mobile experiences.
Lets design a mobile BI experience that speeds up decision-making.

Lets design a mobile BI experience that speeds up decision-making.
What Is Mobile BI in a Manufacturing Context?
Mobile business intelligence for manufacturing delivers dashboards, reports, alerts, and ad-hoc analysis directly to smartphones and tablets. It allows plant managers and operators to access historical data and real-time production metrics for immediate decision-making, no matter where they are standing.
For manufacturers, mobile BI focuses on active monitoring and quick action rather than deep, complex data modeling. Managers use it to track live OEE, log downtime reasons, check scrap rates, and view order status on the fly.
How does mobile BI work on the shop floor? A functional mobile setup combines three main elements:
- Backend data sources: Live feeds from your ERP, MES, SCADA, IoT sensors, and quality management systems.
- A central BI platform: The semantic data model processing the information (such as Power BI).
- Mobile-optimized interfaces: Native apps (like the Power BI mobile app) or responsive web views specifically tailored to fit smaller touch screens.
How Mobile BI Differs from Traditional BI
You cannot simply shrink a desktop dashboard, put it on an iPad, and call it mobile BI. One of the biggest challenges of converting BI reports to mobile is adapting to completely different physical environments and user behaviors.
Context is the biggest differentiator. You look at desktop dashboards after the fact in a conference room. You look at BI reports on phone screens during morning stand-up meetings, mid-shift Gemba walks, and emergency maintenance checks right next to the machines.
| Feature | Traditional BI | Mobile BI |
|---|---|---|
| User Environment | Quiet offices, sitting at a desk. | Noisy shop floors, high-pressure, constant movement. |
| Usage Pattern | Long attention spans, deep data investigation. | Short, frequent interactions (often 3-5 seconds per glance). |
| Design Focus | Heavy, data-dense dashboards with complex drill-downs. | “Scorecard first, dashboard second,” quick status checks. |
| Physical Constraints | Large monitors, precise mouse and keyboard navigation. | Small touch screens, adapting to factory glare and work gloves. |
| Timing of Action | Retrospective analysis during weekly or monthly reviews. | Real-time troubleshooting, immediate threshold alerts. |
The core philosophy for mobile Power BI design is simplicity. Operations leaders consume BI reports on tablet devices to get fast answers, requiring large tap-friendly buttons and instant visibility into critical alerts.
How Tablets and Phones Transform the Shop Floor Manager’s Day
Equipping your production team with mobile devices directly reduces the time wasted walking to shared office PCs and accelerates response times. Giving operators and managers access to real-time mobile business intelligence dashboards right where the work happens changes how daily decisions are made.
Core use cases and scenarios on the shop floor
Using BI reports on tablet screens simplifies complex workflows and brings data directly into the physical workspace. Here is how mobile BI changes daily shop floor behavior:
- Real-time production monitoring: Shop floor managers view live OEE, throughput, scrap, and bottlenecks on tablets positioned near lines or carried during their daily Gemba walks.
- Downtime and maintenance: When machines stop, managers and maintenance leads see instant alerts. They quickly identify root causes – like the top 5 downtime reasons – and coordinate responses without ever returning to a desktop PC.
- Quality control: Operators capture defect data and view quality trends on a tablet. This visibility enables immediate containment and process adjustments before a small defect becomes a massive batch failure.
- Scheduling and sequencing: Shift supervisors check current order status, WIP (Work in Progress), and upcoming changeovers, allowing them to make on-the-spot decisions about line priorities.
- Collaboration on the floor: Mobile dashboards support stand-up meetings at production boards. Managers and teams view the same KPIs, annotate issues, and log action items directly from their devices.
- Direct floor feedback: Operators can enter data – such as logging specific downtime reasons or adding shift comments – via mobile devices. This feeds accurate, real-time context back into the BI models.
Tablets make instructions and data vastly more accessible. Factory workers consistently perceive touch-based devices as simpler to use than traditional desktop computers, which lowers the barrier to entry for shop floor analytics.
Examples of KPIs and dashboards that work well on mobile
The most effective mobile BI reports are role-based. They show only the most important visual data up front and keep less-used details a tap away to reduce screen clutter.
Delivering Power BI on mobile requires tailoring the view so each user gets answers in five seconds or less. Here is a blueprint for role-based mobile dashboards:
- Plant Manager: OEE (availability, performance, quality), throughput per line, overall scrap rate, top 5 bottlenecks, and on-time order completion status.
- Shift Supervisor: Real-time status by line and work center (running or stopped), planned vs. actual output quantity, changeover schedules, and operator attendance.
- Maintenance Lead: Open work orders, MTTR (Mean Time To Repair), MTBF (Mean Time Between Failures), critical asset health, and unplanned vs. planned downtime ratios.
- Quality Manager: Defect rates by product and shift, Pareto charts of defect types, first-pass yield, and total holds/rework.
Tools like mobile Power BI allow users to filter these metrics by line, product, shift, or plant directly from their devices using touch-friendly slicers and saved bookmarks.
The Business Impact of Going Mobile
Contrasting the old way of working (clipboards and delayed data) with mobile-first analytics reveals significant operational improvements. Industry tracking shows two major outcomes when implementing mobile BI for downtime and maintenance:
- 3x faster decision cycles: Accessing BI reports on phone screens eliminates the lag between a machine failing and a manager diagnosing the data.
- Wider adoption of BI tools: When dashboards are placed in the pockets of your workforce rather than hidden on office desktops, daily active usage across the shop floor increases significantly.
Our Data Consulting Services You Might Find Interesting

Data Warehouse Consulting Services
We design, build, and modernize data warehouses that bring order to your fragmented data.

Modern Data Architecture Services
We design and implement data architectures that replace aging legacy systems with a scalable cloud foundation.

Data Governance Consulting & Integration
We help you build a practical system of trust around your information. We work with you to make sure your data is accurate.
Designing Effective Mobile BI Dashboards for Shop Floor Managers (with Power BI)
Designing for mobile is not just making desktop charts smaller. It is about speed, clarity, and utility in a demanding physical environment. Optimizing dashboards for mobile devices requires answering one primary question: What does the shift supervisor need to see in five seconds while standing at the production line?
At Multishoring, we design mobile layouts as a first-class citizen, not an afterthought. We reuse your existing management dashboards and QBR data foundations but aggressively simplify the interface for the shop floor.
Mobile UX Principles for Phones and Tablets
Shop floors present unique ergonomic challenges. You are designing for screen glare, workers wearing protective gloves, and noisy environments where intense focus is difficult.
To make mobile Power BI practical for your operations team, follow these core UX design principles:
| UX Principle | Shop Floor Application | Why It Matters |
|---|---|---|
| Vertical Scanning | Use a single-column layout for phones. | Avoids horizontal scrolling and “pinching” to see data while moving. |
| Hierarchical Layout | Place critical KPIs (OEE, line status) at the very top. | Ensures the most important answer is visible in under 5 seconds. |
| Touch Optimization | Use large, tap-friendly cards and slicers. | Accommodates users wearing gloves or working in high-vibration areas. |
| Visual Simplification | Use traffic lights (Red/Yellow/Green) and minimal labels. | Allows for instant status recognition in noisy, distracting environments. |
| High Contrast | Use big fonts and bold color palettes. | Combats screen glare from overhead factory lighting. |
| Performance First | Limit data queries and use caching/import modes. | Ensures reports load instantly on shop floor Wi-Fi or 4G/5G. |
Power BI Mobile Optimization, Security, and Offline Access
Enterprise IT teams often worry about the mobile BI security risks associated with putting proprietary manufacturing data on portable devices. Fortunately, modern platforms provide robust ways to protect your data while maintaining usability.
When building mobile BI reports in Power BI, you should utilize the specific “mobile layout” view. This allows you to design a tailored phone interface that safely reuses the exact same underlying dataset as your desktop reports. It also enables native mobile alerts and push notifications, pinging a manager’s phone the second OEE drops below a defined target.
How to secure mobile BI applications:
- Row-Level Security (RLS): Implement RLS to restrict data access based on the user. A plant manager sees the whole facility, while a line supervisor only sees data for their specific machines.
- Device Management: Integrate your BI platform with MDM/MAM (Mobile Device Management) tools like Microsoft Intune. Enforce Conditional Access policies and require biometric authentication to open company reports.
- Data Protection: Protect against lost or stolen devices by enabling remote wipe capabilities, enforcing device encryption, and restricting app access on public Wi-Fi networks without a VPN.
Handling mobile BI with offline capabilities:
Manufacturing plants are notorious for Wi-Fi dead zones. To solve mobile BI offline data access solutions, configure your mobile Power BI apps to cache data on the device. Design reports that remain highly useful even if the data is slightly stale. Use pre-filtered views and bookmarks so supervisors can instantly open essential dashboards without waiting for a fresh data query to load in a low-connectivity area.
Implementing Mobile BI on the Shop Floor: A Practical Roadmap
Deploying mobile BI is as much about process as it is about technology. Success requires moving beyond just “throwing dashboards onto tablets.” Use this phased approach to ensure high adoption and clear ROI.
Technical and Organizational Prerequisites
Before rolling out hardware, you must establish a solid foundation:
- Process Clarity: Map your value streams. Don’t just digitize an inefficient manual process; define exactly where a mobile data point changes a decision.
- Data Foundations: Integrate your ERP, MES, and IoT sensors into a clean, unified data model.
- Infrastructure: Ensure reliable Wi-Fi or cellular coverage in every corner of the plant. Invest in ruggedized tablets and mounts designed for industrial use.
- Stakeholder Alignment: Identify “Product Owners” on the manufacturing side who will champion the tool, not just IT.
The 5-Phase Implementation Roadmap
- Discover & Design: Pick one high-value pilot (e.g., live OEE for a single line) and sketch mobile-first views with direct input from supervisors.
- Build & Integrate: Connect your systems and build the Power BI data model. Create both desktop and mobile-optimized layouts using the same dataset.
- Secure & Govern: Implement Row-Level Security (RLS) and mobile device management (MDM) to protect data.
- Pilot: Roll out to a small group. Collect feedback on usability—especially how the dashboards perform in the heat of a shift.
- Scale: Refine based on feedback and expand to more plants. Integrate these mobile views into your daily management rituals and QBRs.
Pitfalls to Avoid: Avoid “mobile dashboard sprawl” by periodically retiring unused reports. Focus on change management—a dashboard is only useful if it is embedded into daily stand-ups and shift handovers.
At Multishoring, we act as a partner through this entire roadmap. We help manufacturing teams bridge the gap between complex data modeling and the simplified, mobile-ready experiences that shop floor managers actually use.
To Conclude
Mobile BI on tablets and phones is no longer a luxury for manufacturers; it is a fundamental tool for reducing downtime and accelerating decision-making. By putting real-time data into the pockets of shop floor managers, you bridge the gap between back-office analysis and front-line action. Success in this transition does not require a complete overhaul of your existing systems – it simply requires a shift in how you present data, moving from dense desktop reports to simplified, actionable mobile dashboards.
The most effective way to start is by picking one high-impact area, such as a live OEE dashboard for a critical production line, and designing a mobile-optimized Power BI report that fits into the daily routine. Focus on user adoption by ensuring these tools are used in daily stand-ups and Gemba walks. Remember that technical implementation must be paired with robust data governance and mobile security strategies to protect your proprietary manufacturing data while ensuring it remains accessible where it is needed most.
At Multishoring, we specialize in helping manufacturing companies transform their data into competitive advantages. We build and optimize the Power BI models and reports that form your data foundation, and then we extend that value to the shop floor with mobile-ready dashboards tailored for operations roles. If you are ready to move from clipboards to real-time analytics, reach out to our team for an assessment of your current BI environment and a roadmap for mobile optimization.


