
Content

Planning for Q2 and Q3 usually involves a lot of debate. The sales team predicts a massive spike. The operations team prepares for a conservative baseline. The finance team tries to find the truth somewhere in the middle.
When companies rely on older reporting software, this debate is based entirely on human intuition. Legacy reporting systems are designed to look backward. They can tell you exactly what you sold last year, but they force you to guess what you will sell tomorrow.
Modern finance and supply chain teams are removing the guesswork. By migrating to Power BI, they unlock built-in AI features that handle demand forecasting automatically. Instead of arguing over spreadsheet estimates, these teams use historical data to generate mathematically sound predictions.
This shift prevents the two biggest mistakes in inventory planning: tying up cash in overstock, or losing revenue to stockouts.
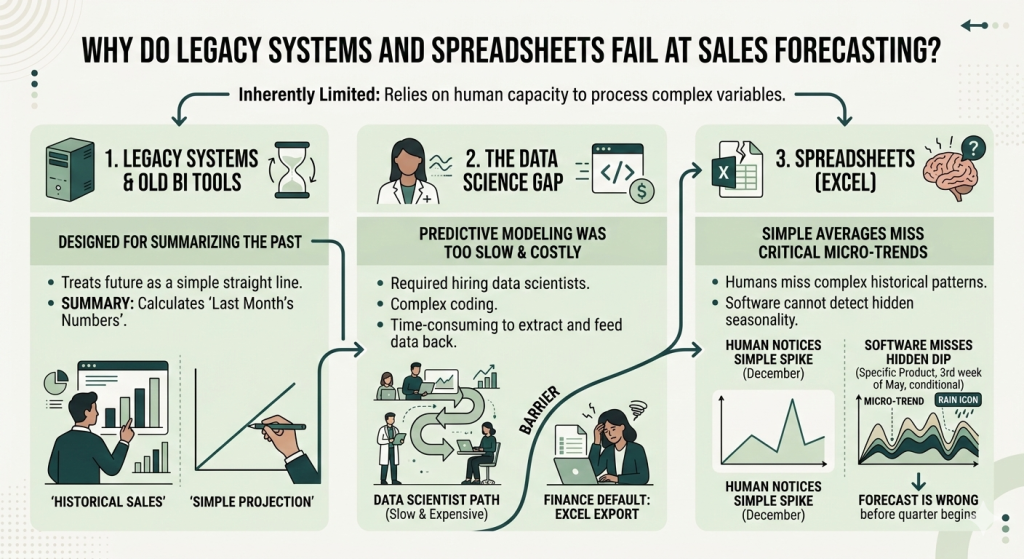
Why Do Legacy Systems and Spreadsheets Fail at Sales Forecasting?
They fail because they rely on human capacity to process complex historical variables, which is inherently limited. They treat the future as a simple straight line based on last month’s numbers.
Older Business Intelligence (BI) tools were built to summarize the past. If you wanted a predictive model ten years ago, you had to hire a data scientist to extract the data, write complex code, and feed the results back into the system. Because this was too expensive and slow, finance teams defaulted back to exporting data into Excel.
In Excel, analysts calculate simple averages. But simple averages miss micro-trends. A human might notice that sales spike every December. A human will likely miss that sales of a specific product dip by 4% every third week of May unless it rains. When your software cannot detect these hidden seasonal patterns, your forecast is wrong before the quarter even begins.
What Is AI-Driven Demand Forecasting?
It is the use of statistical algorithms to analyze your past sales data, identify hidden seasonal patterns, and automatically calculate future demand.
It removes human bias from the planning process. The algorithm does not care about the sales director’s optimism or the supply chain manager’s caution. It only looks at the mathematical reality of your historical data.
When you feed three years of accurate sales history into the model, the AI detects the exact trajectory of your growth. It identifies recurring cycles, weighs recent trends heavier than older ones, and produces an objective baseline for your Q2 and Q3 targets.
How Does Power BI Use Built-In AI to Predict Sales?
Power BI predicts future sales by applying a statistical method called Exponential Smoothing directly to your line charts with a single click, completely eliminating the need to write custom code.
You do not need a machine learning degree to use it. If you have a line chart showing your monthly revenue, you simply open the analytics pane in Power BI and turn on the “Forecast” feature. The system instantly draws a projection line into the future.
The tool provides two massive advantages for financial planning:
- Automatic Seasonality Detection: Power BI automatically finds the recurring cycles in your data. If your manufacturing output always drops in August due to factory maintenance, the forecast will automatically dip the projected line for next August.
- Confidence Intervals: The system does not just give you one number. It displays a shaded grey band around the projected line. This represents the high and low boundaries of your forecast. A CFO can look at the lower boundary to prepare a worst-case cash flow scenario, while operations can look at the upper boundary to prepare maximum inventory levels.
Still guessing your Q3 sales numbers?
Migrate from legacy reporting to Power BI. Our data experts help you clean your historical data and implement built-in AI forecasting, so you can stop guessing and start planning.
Move beyond manual spreadsheets.

Move beyond manual spreadsheets.
Can You Trust the Algorithm? The Role of Historical Data
You can only trust an AI forecast if your historical data is clean, unified, and accurate. If you feed the algorithm duplicates, missing months, or incorrect categories, the projection will be completely useless.
This is why migrating from a legacy system to a modern BI tool requires smart data engineering. You cannot just plug Power BI into a messy database and expect perfect predictions.
To get an accurate Q3 forecast, you need a solid data foundation. The system needs to read from a single source of truth where the data has been standardized (like the Silver and Gold layers of a Lakehouse architecture). If your European sales are recorded in Euros and your US sales in Dollars, and nobody harmonized them, the AI will fail to find the correct trend.
Our Data Consulting & BI Services You Might Find Interesting

Power BI Consulting
We provide the strategic guidance and specialized knowledge needed to transform your data challenges.

Databricks Professional Services & Consulting
From data preparation to model development and deployment, we ensure a seamless integration of technologies.

Power BI Implementation
Our expert team customizes every aspect of Power BI to fit your business needs for seamless integration and performance.
How Does Migrating to Power BI Change Your FP&A Workflow?
Migrating from older reporting tools to Power BI shifts your team from manually assembling forecasts to actually planning the business strategy around an automated forecast.
When you stop fighting with legacy software to extract data, you gain time. An analyst no longer spends the first week of the month updating Excel formulas to guess the next quarter’s demand. The forecast updates automatically every time the database refreshes.
At Multishoring, we help companies abandon rigid, outdated reporting systems. We migrate your historical data, clean it, and set up the automated data models required to make Power BI’s forecasting features work perfectly. This allows your team to stop debating the numbers and start preparing for the future.


